A custom heads-up display (HUD) for your 350z can transform your driving experience. This guide explores how to leverage the OBD2 port and the Controller Area Network (CAN) to gather real-time vehicle data, laying the groundwork for building your own custom HUD.
Accessing your 350z’s data starts with the On-Board Diagnostics II (OBD2) port, a standardized interface located under the driver-side dash. While mechanics use it for diagnostics, it also offers a wealth of information for DIY projects. The OBD2 port provides access to standard parameters like engine speed, coolant temperature, and fuel system status. However, to unlock more in-depth data, we need to delve into the CAN.
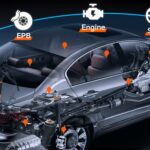
Modern vehicles, including the 350z, utilize a CAN to connect various control modules, enabling them to communicate and share crucial data. This network operates on just two wires—CAN-H and CAN-L—significantly simplifying wiring and making it accessible through pins 6 and 14 on the OBD2 port. Tapping into the CAN allows us to observe the intricate workings of the vehicle in real time.
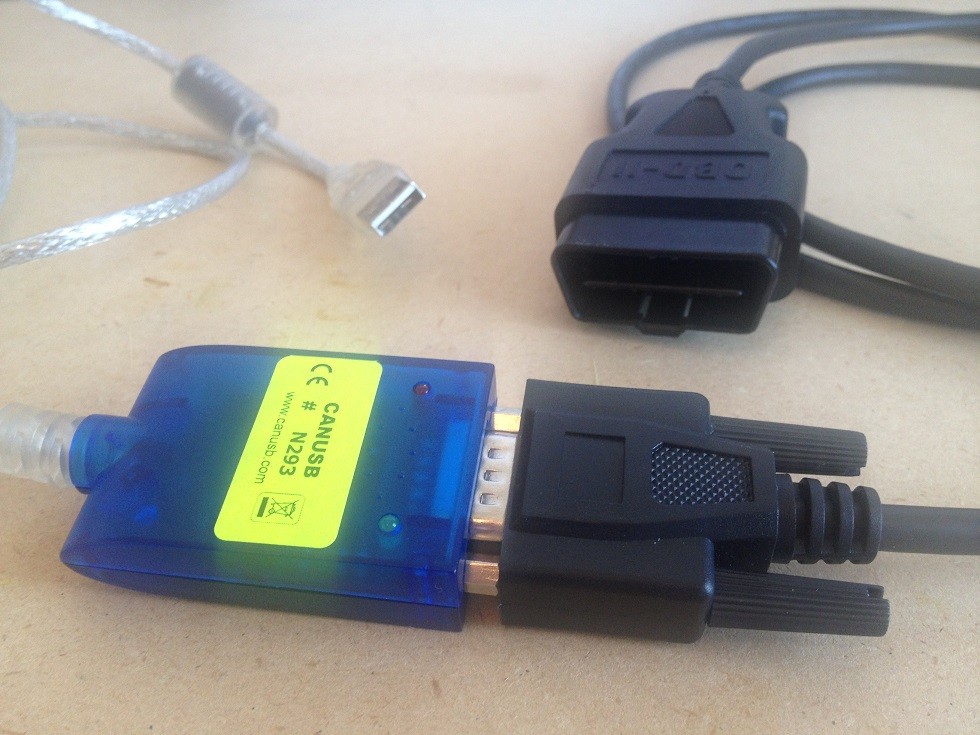
To interface with the CAN, a CANUSB module and an OBD2-to-serial cable are required. The OBD2 cable might require modification to ensure proper connection to the CAN-H and CAN-L lines. A typical modification involves soldering the following:
- CAN-L: Serial brown wire to OBD2 gray wire
- Ground: Serial purple wire to OBD2 brown wire
- CAN-H: Serial white wire to OBD2 purple wire
With the hardware connected, custom software is necessary to communicate with the CANUSB module and decode the incoming data. A dedicated program can log and filter messages based on their unique ID. For instance, filtering for ID 180 might reveal specific data streams relevant to the 350z.
While the 350z’s CAN might utilize a limited number of IDs (around 30), each message can contain up to 8 bytes of data, representing various parameters. Decoding this information requires careful analysis, as each byte or combination of bytes can correspond to different vehicle functions like gas pedal position, vehicle speed, or status lights.
To simplify this process, data visualization tools are invaluable. These programs can graphically represent the logged data, making it easier to identify patterns and correlations.
This visual representation, while unfiltered, provides a foundation for further analysis. Combining this data with standard OBD2 parameters allows for cross-referencing and a deeper understanding of the CAN data structure. This understanding is crucial for developing a custom 350z OBD2 heads-up display. Further decoding efforts can be documented in a spreadsheet to track progress and share findings. This initial exploration into accessing and interpreting vehicle data via the OBD2 port and CAN bus forms the basis for building a personalized heads-up display, offering a unique and informative driving experience.